

Àpèjúwe
Chartsy is a powerful WordPress chart plugin built with ApexCharts.js, designed to create responsive, interactive, and visually appealing charts. It uses high-performance SVG rendering to ensure smooth animations, precise interactivity, and sharp display across all devices. Whether youÌtumọ̀ Yorùbá: ’re showcasing business data or complex analytics, Chartsy makes your data easy to understand and engaging.
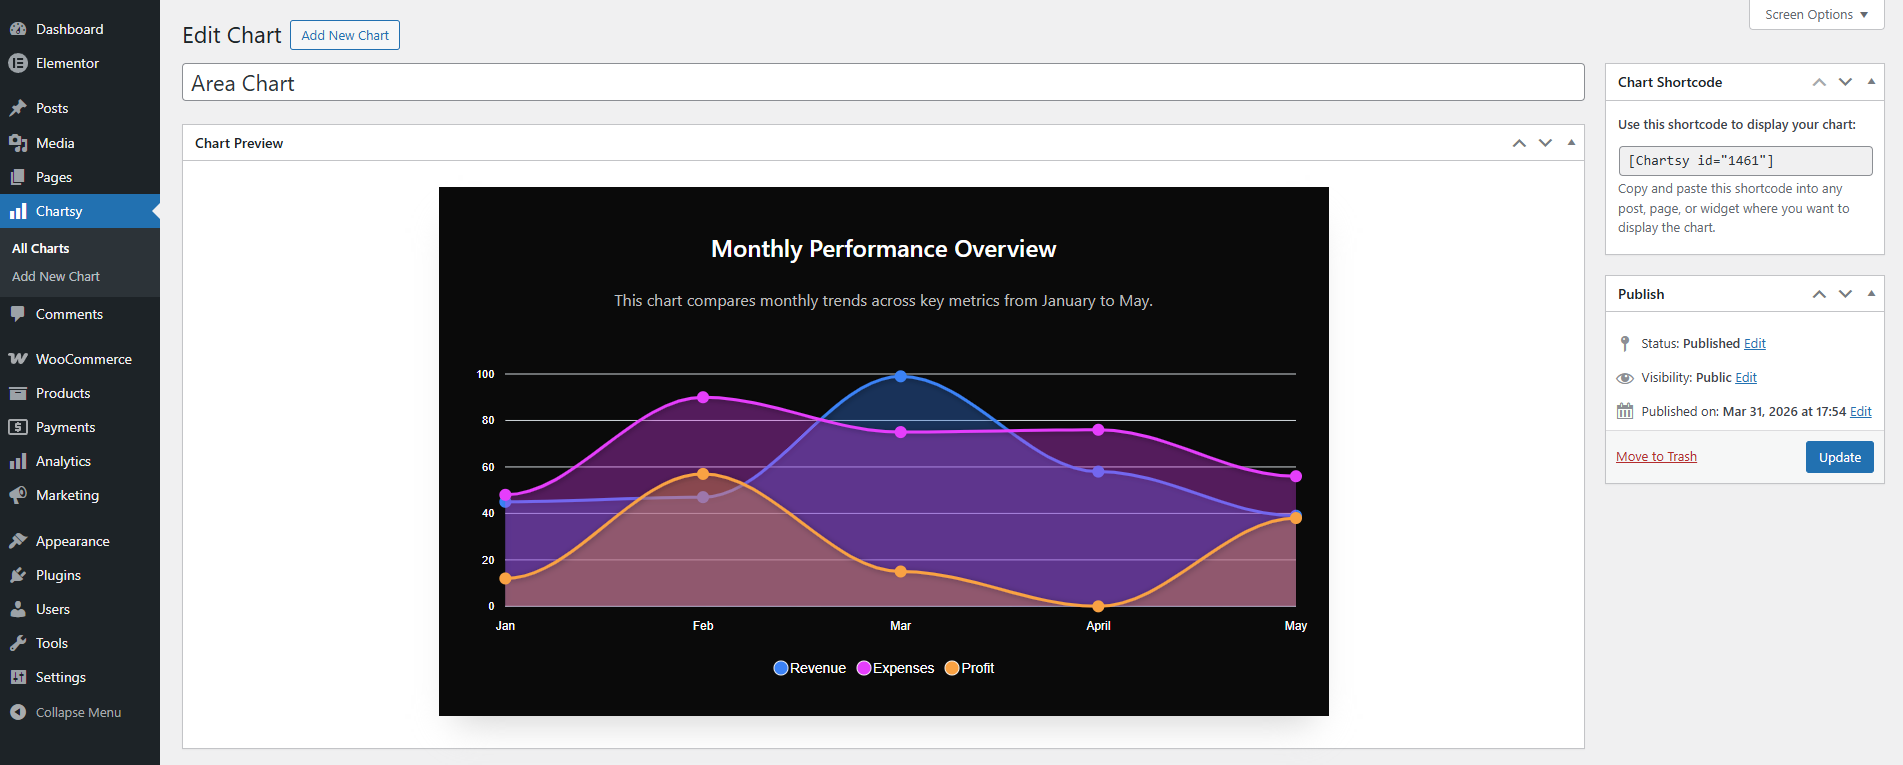
With an intuitive admin interface and real-time preview, you can quickly customize charts by adjusting colors, fonts, legends, and axes. This flexibility helps you build professional data visualizations faster and more efficiently without any complexity.
Features
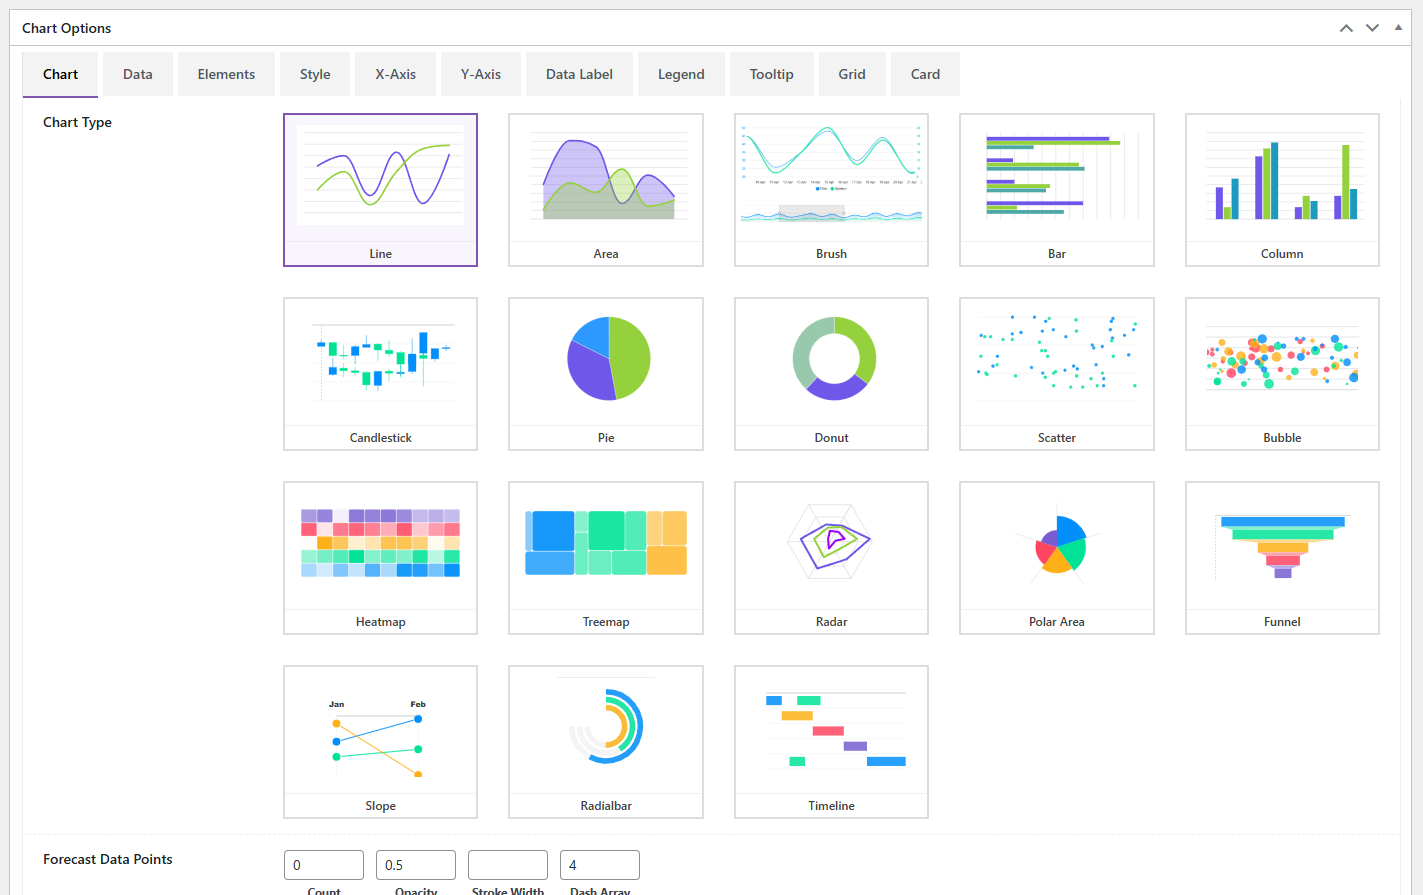
⭐ 18+ Advanced Chart Types – Create everything from standard Line, Area, and Bar charts to complex Candlestick, Heatmap, Treemap, Timeline, Radar, and Polar Area visualizations.
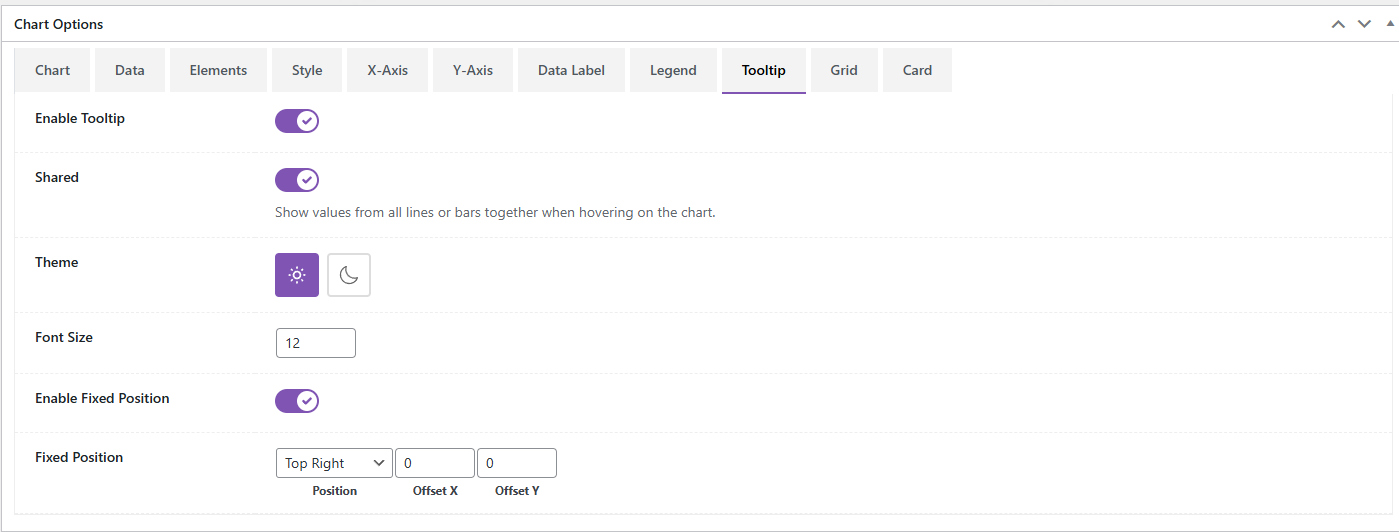
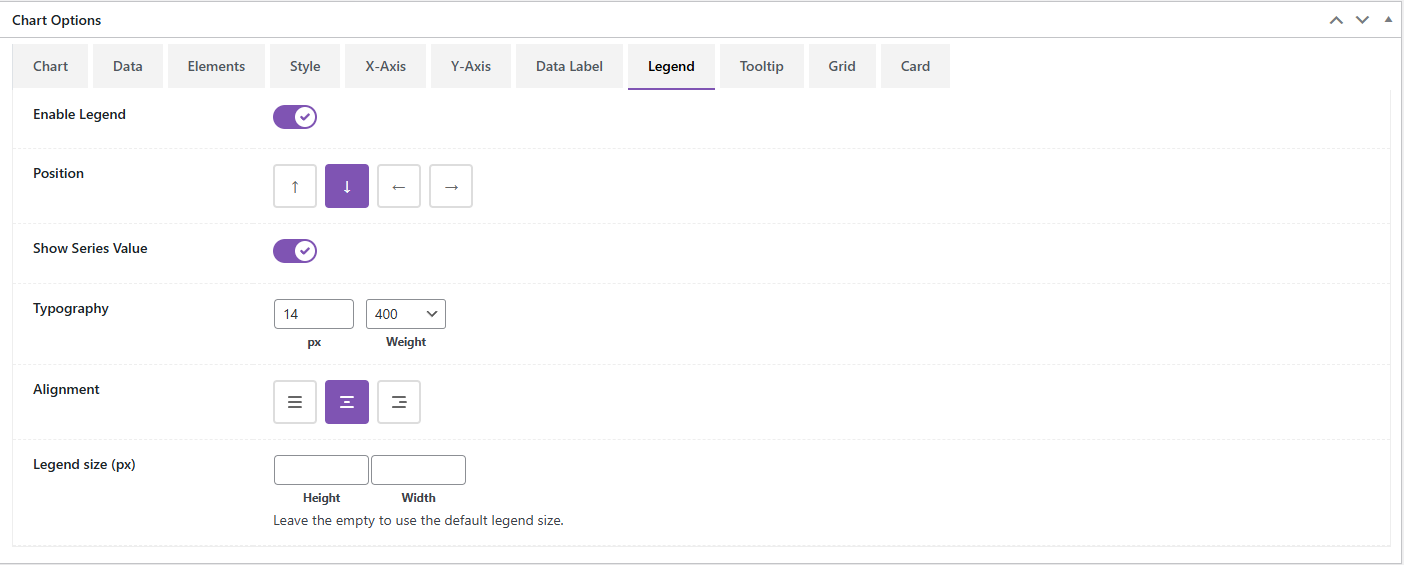
⭐ Dynamic Multi-Series Support – Easily manage multiple data series in a single chart with synchronized legends, shared tooltips, and independent styling for every series.
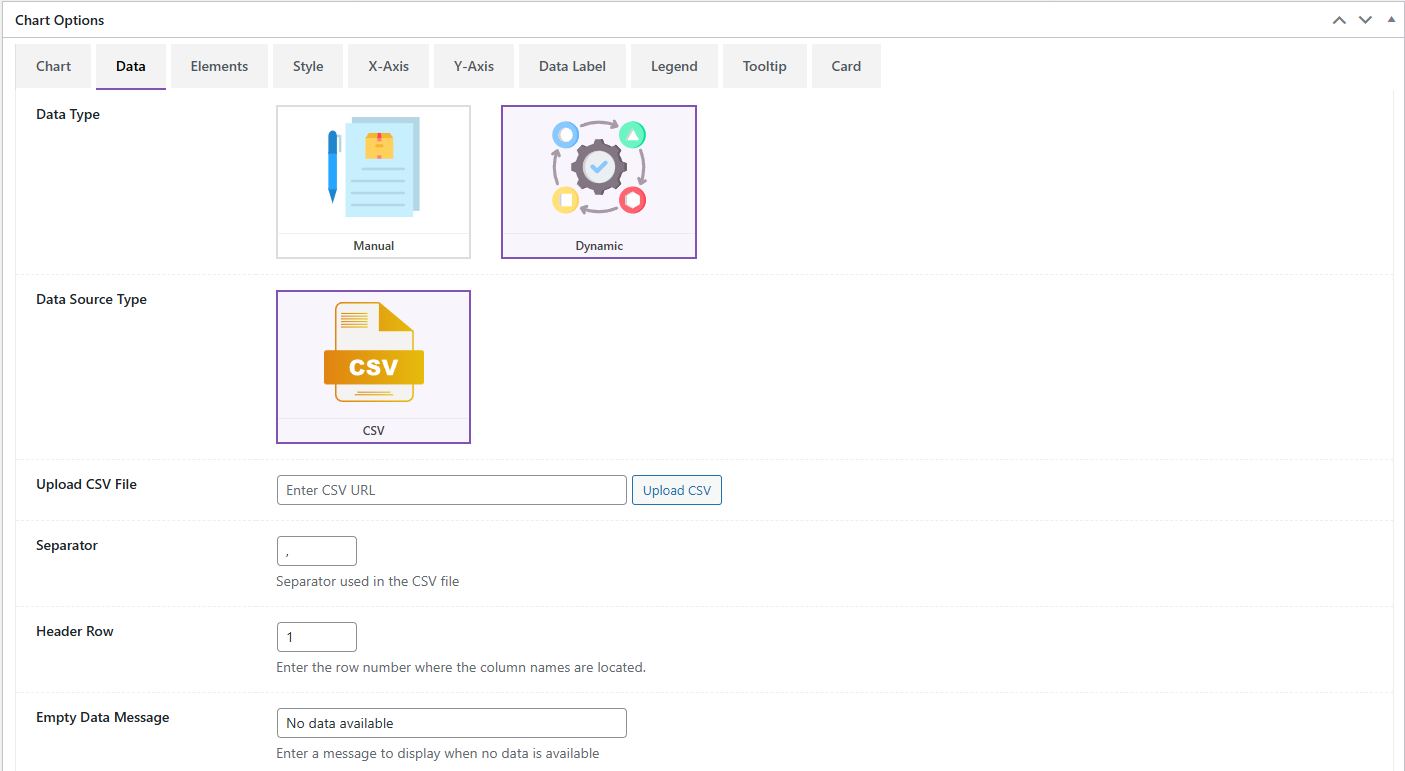
⭐ Flexible Data Connection – Connect to manual data entry, local or remote CSV files, Google Sheets, SQL databases, REST APIs, or use custom WordPress filters for deep programmatic integration.
⭐ Interactive Toolbar & Controls – Empower users with built-in tools for Zooming (pinching supported), Panning, Selection-zooming, and a one-click Reset to the original view.
⭐ Professional Export Suite – Provide users with the ability to download charts directly as PNG images, SVG files, or CSV/PDF documents for offline viewing and reporting.
⭐ Real-time Admin Preview – Experience zero-latency editing with a live preview system that reflects every change to data sources or styling immediately within the admin panel.
⭐ Precision Plot Options – Deep control over chart geometry including rounded corners (border-radius), stack types (Normal vs 100% Stacked), grouped bars, and custom offset values.
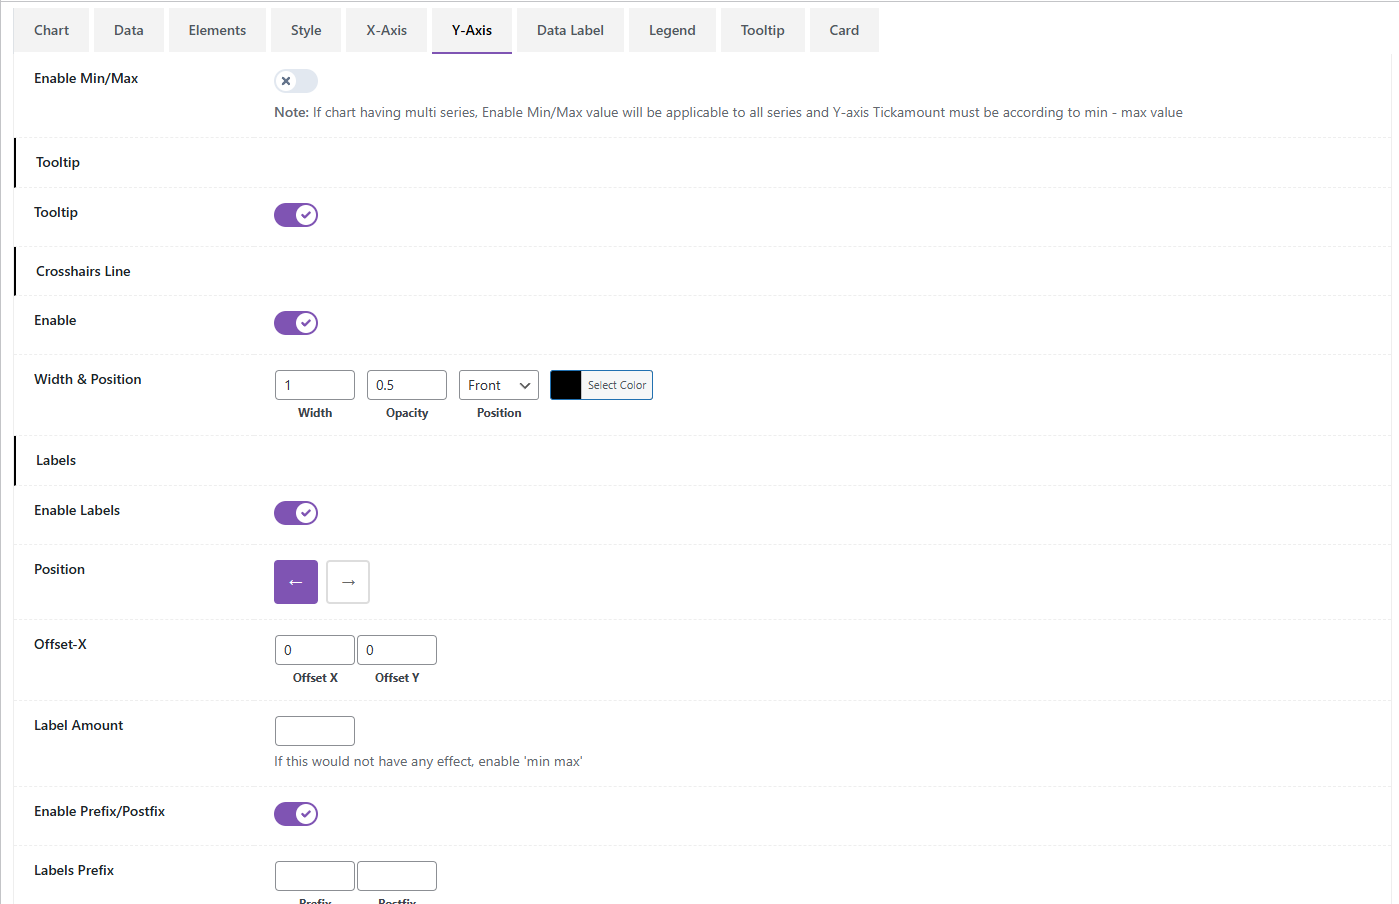
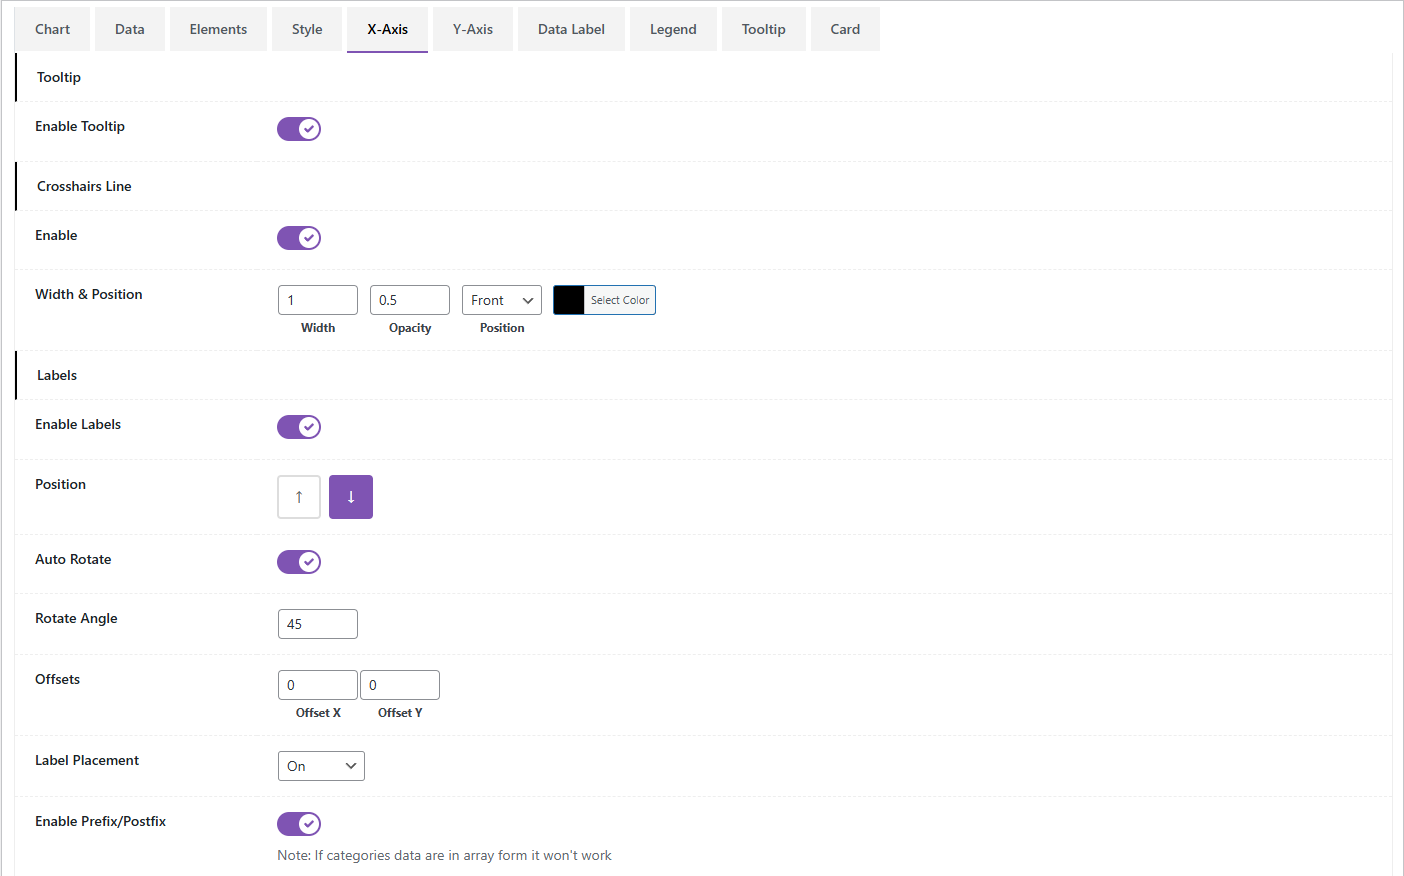
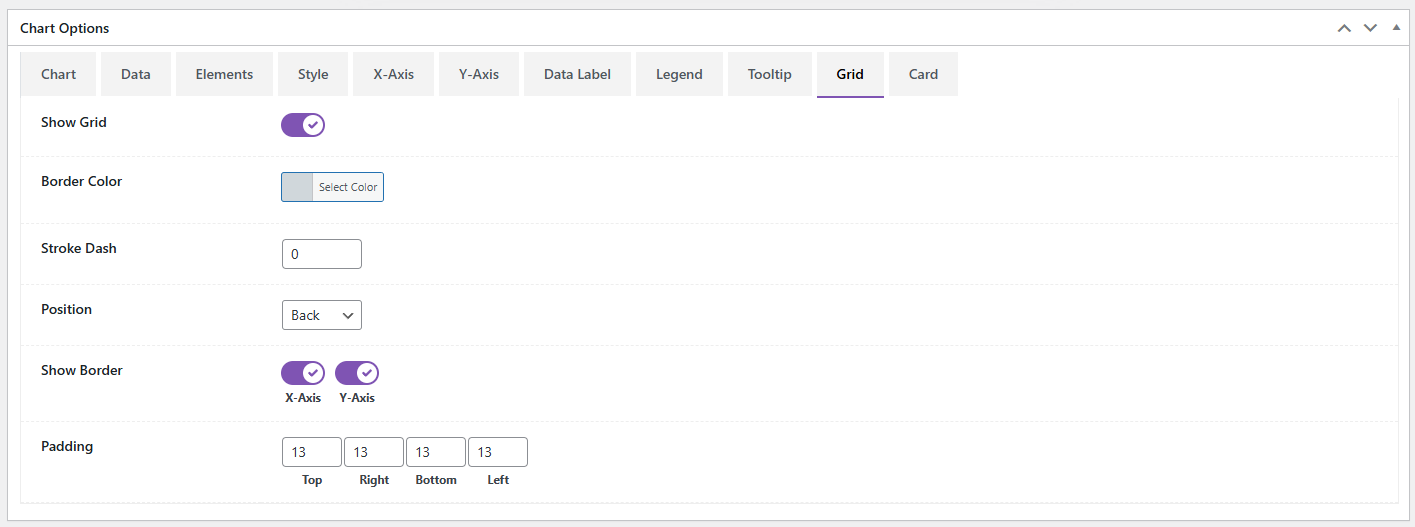
⭐ Advanced Axis Customization – Configure multiple Y-axes, custom label formatting, shared scales, grid-line visibility, and precise range controls for both X and Y dimensions.
⭐ Premium Card Design System – Wrap your charts in beautiful “cards” with custom background gradients, adjustable padding/margins, solid or dashed borders, and rich box-shadow effects.
⭐ Elementor Widget – Elementor widget for chartsy charts there easily drag and drop and choose your chart.
⭐ Dynamic Annotations & Labels – Add custom data labels, markers, and forecast points to highlight specific values or trends, with full control over font styles and background colors.
⭐ Developer Friendly Architecture – Built for developers with extensive hooks (filters and actions) allowing you to inject data or modify chart configurations programmatically.
⭐ Responsive & Touch Optimized – Charts are fully adaptive by default, responding to screen size changes and supporting native touch gestures for mobile interactions like swipe and pinch.
⭐ 24/7 Dedicated Support – Our expert support team is available around the clock to help you with installation, configuration, or any technical questions you may have.
⭐ Shortcode Support – Seamlessly embed your charts anywhere on your site using simple shortcodes: [Chartsy id="123"].
External Services
This plugin includes the following open-source libraries:
- ApexCharts.js
A modern interactive SVG chart library used to power the chart functionality.
License: MIT
Àwọn àwòrán ìbòjú
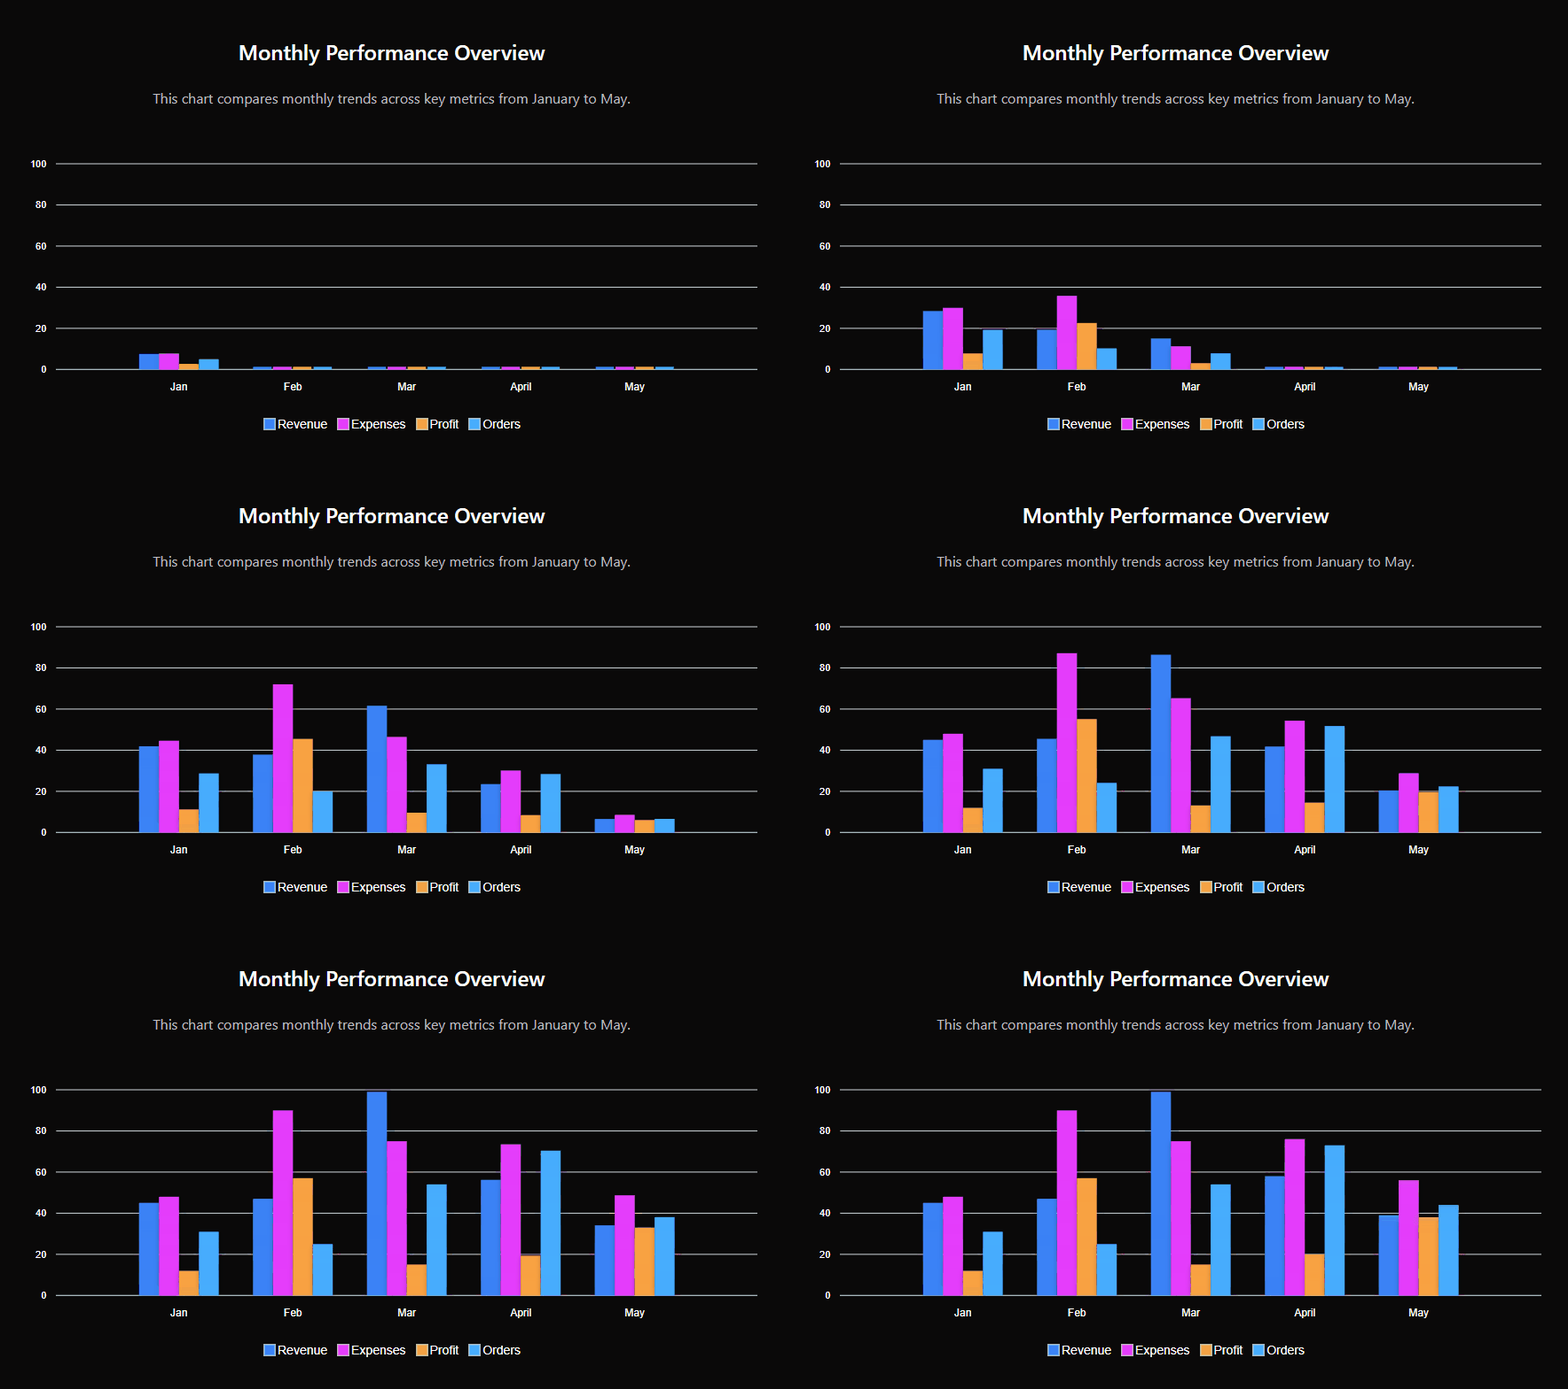
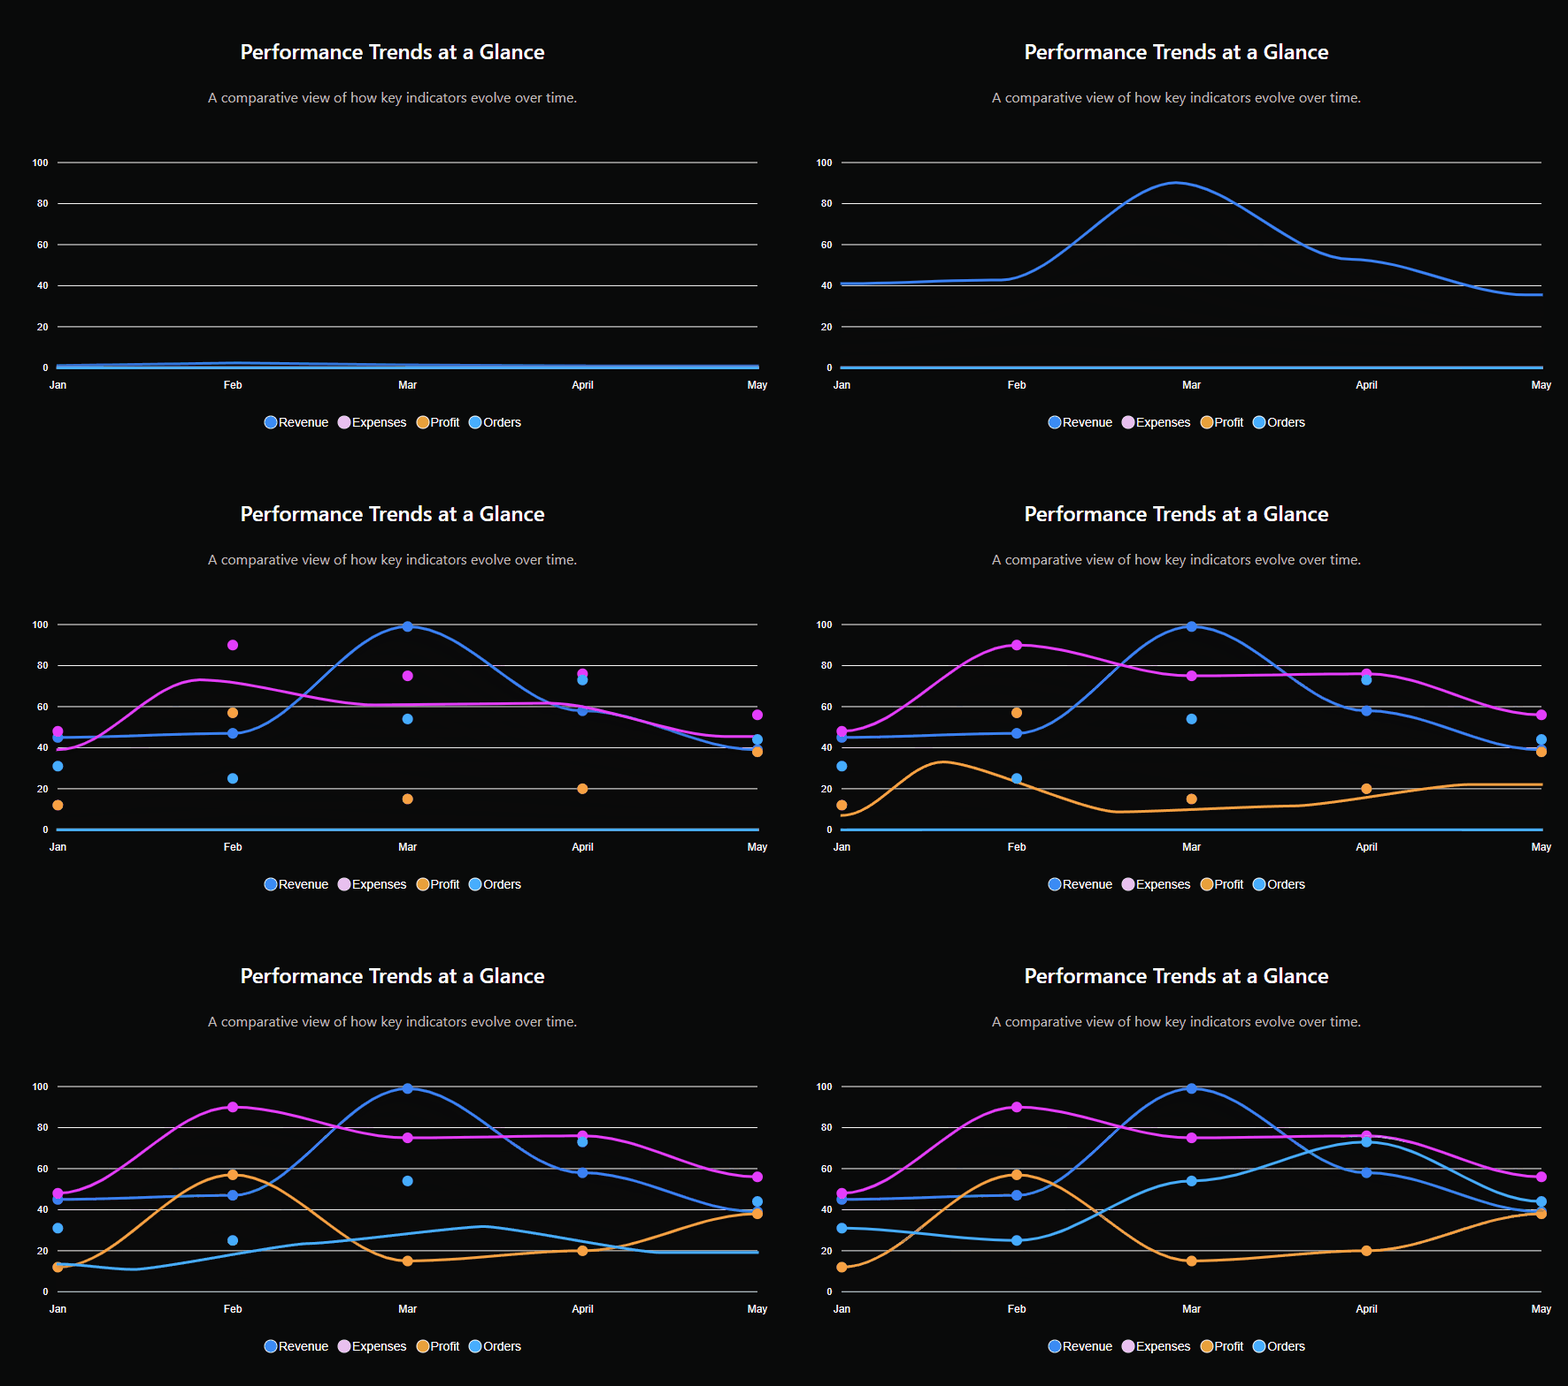
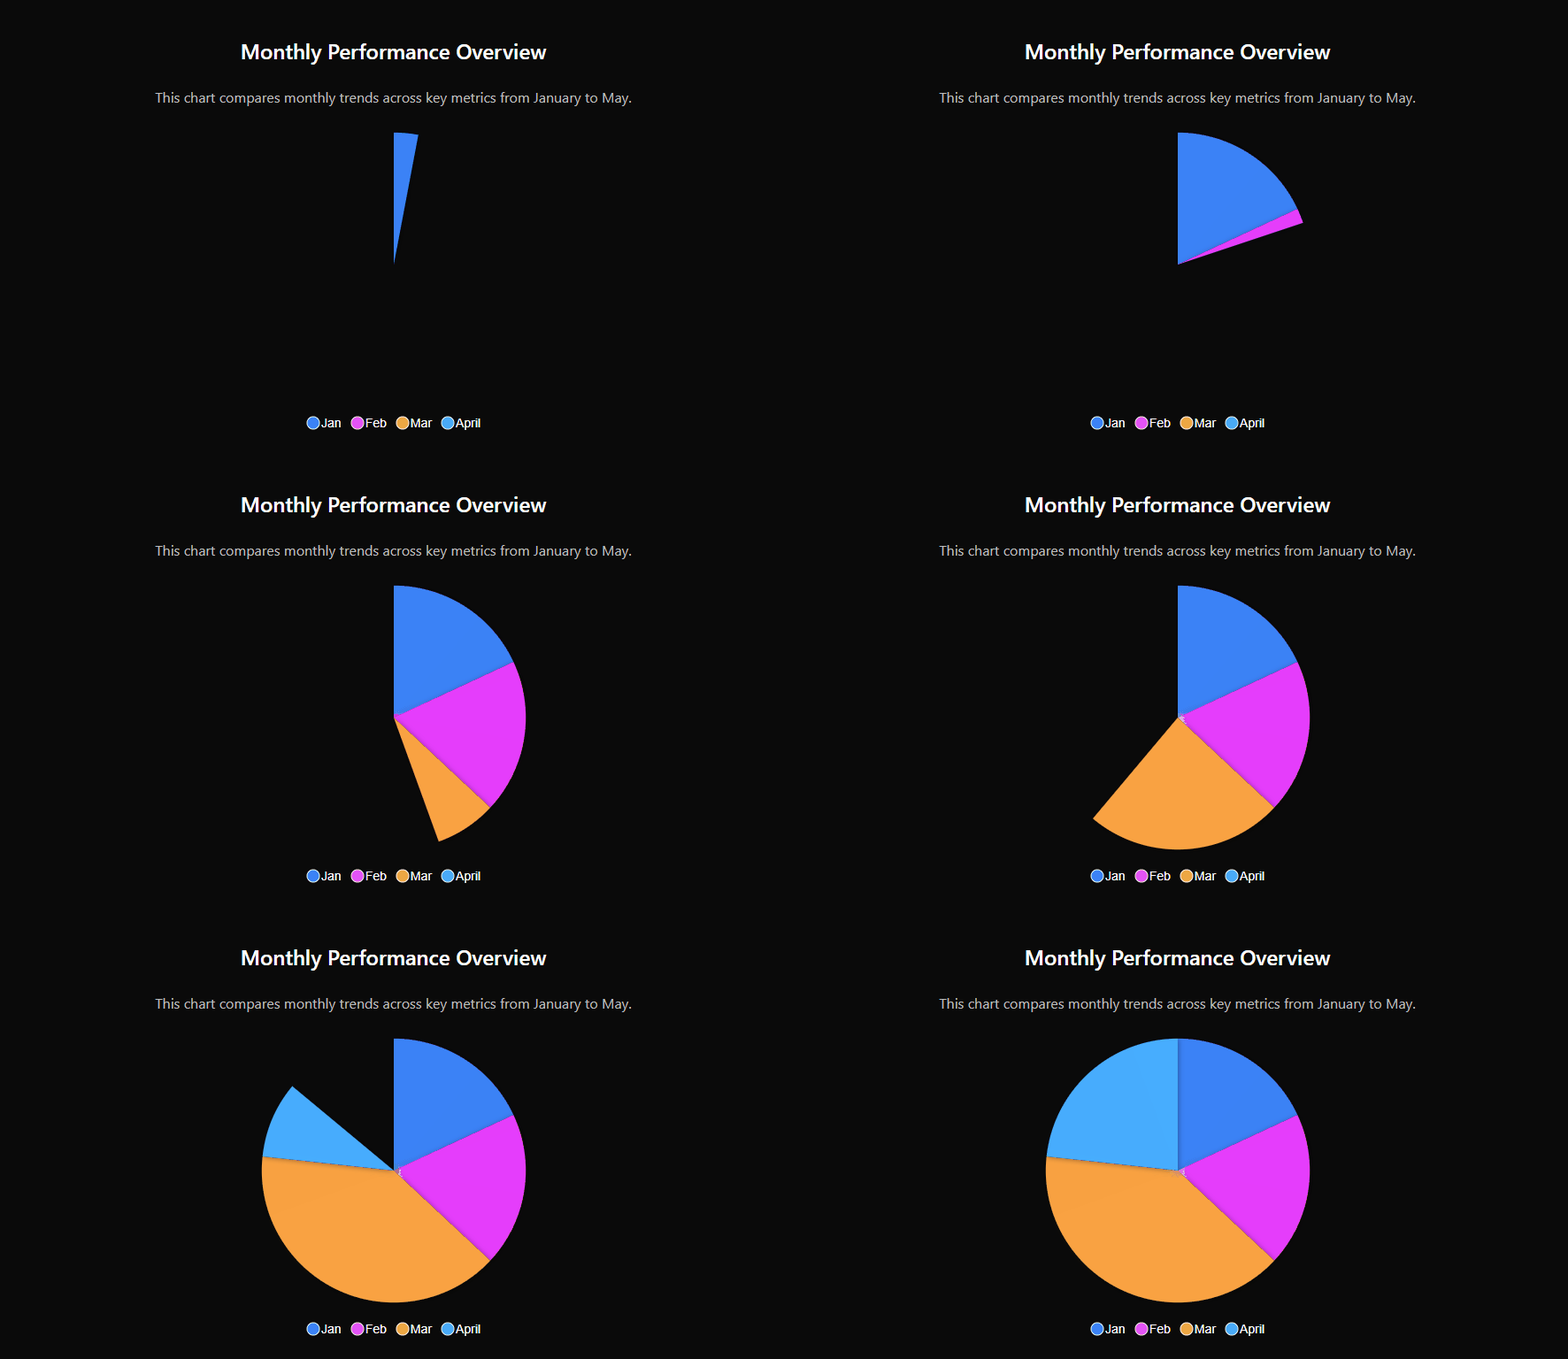
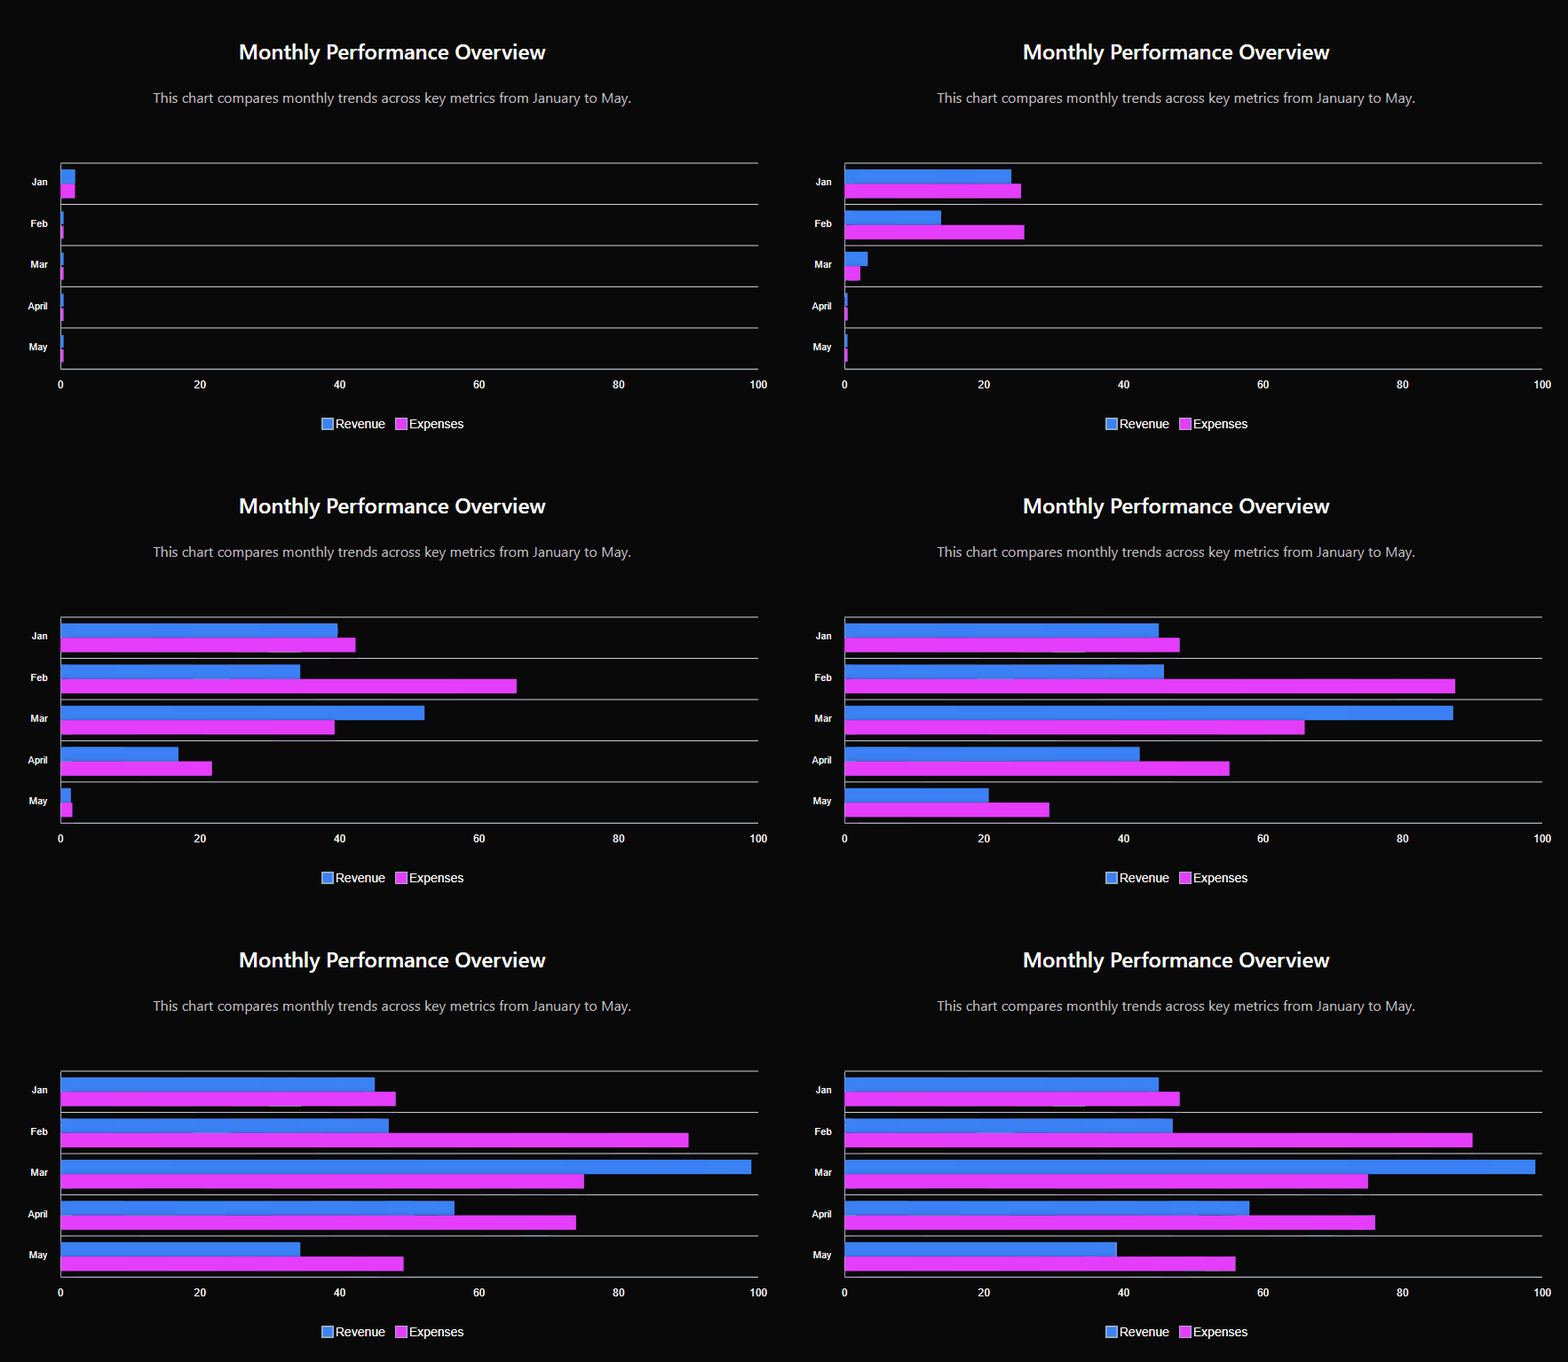
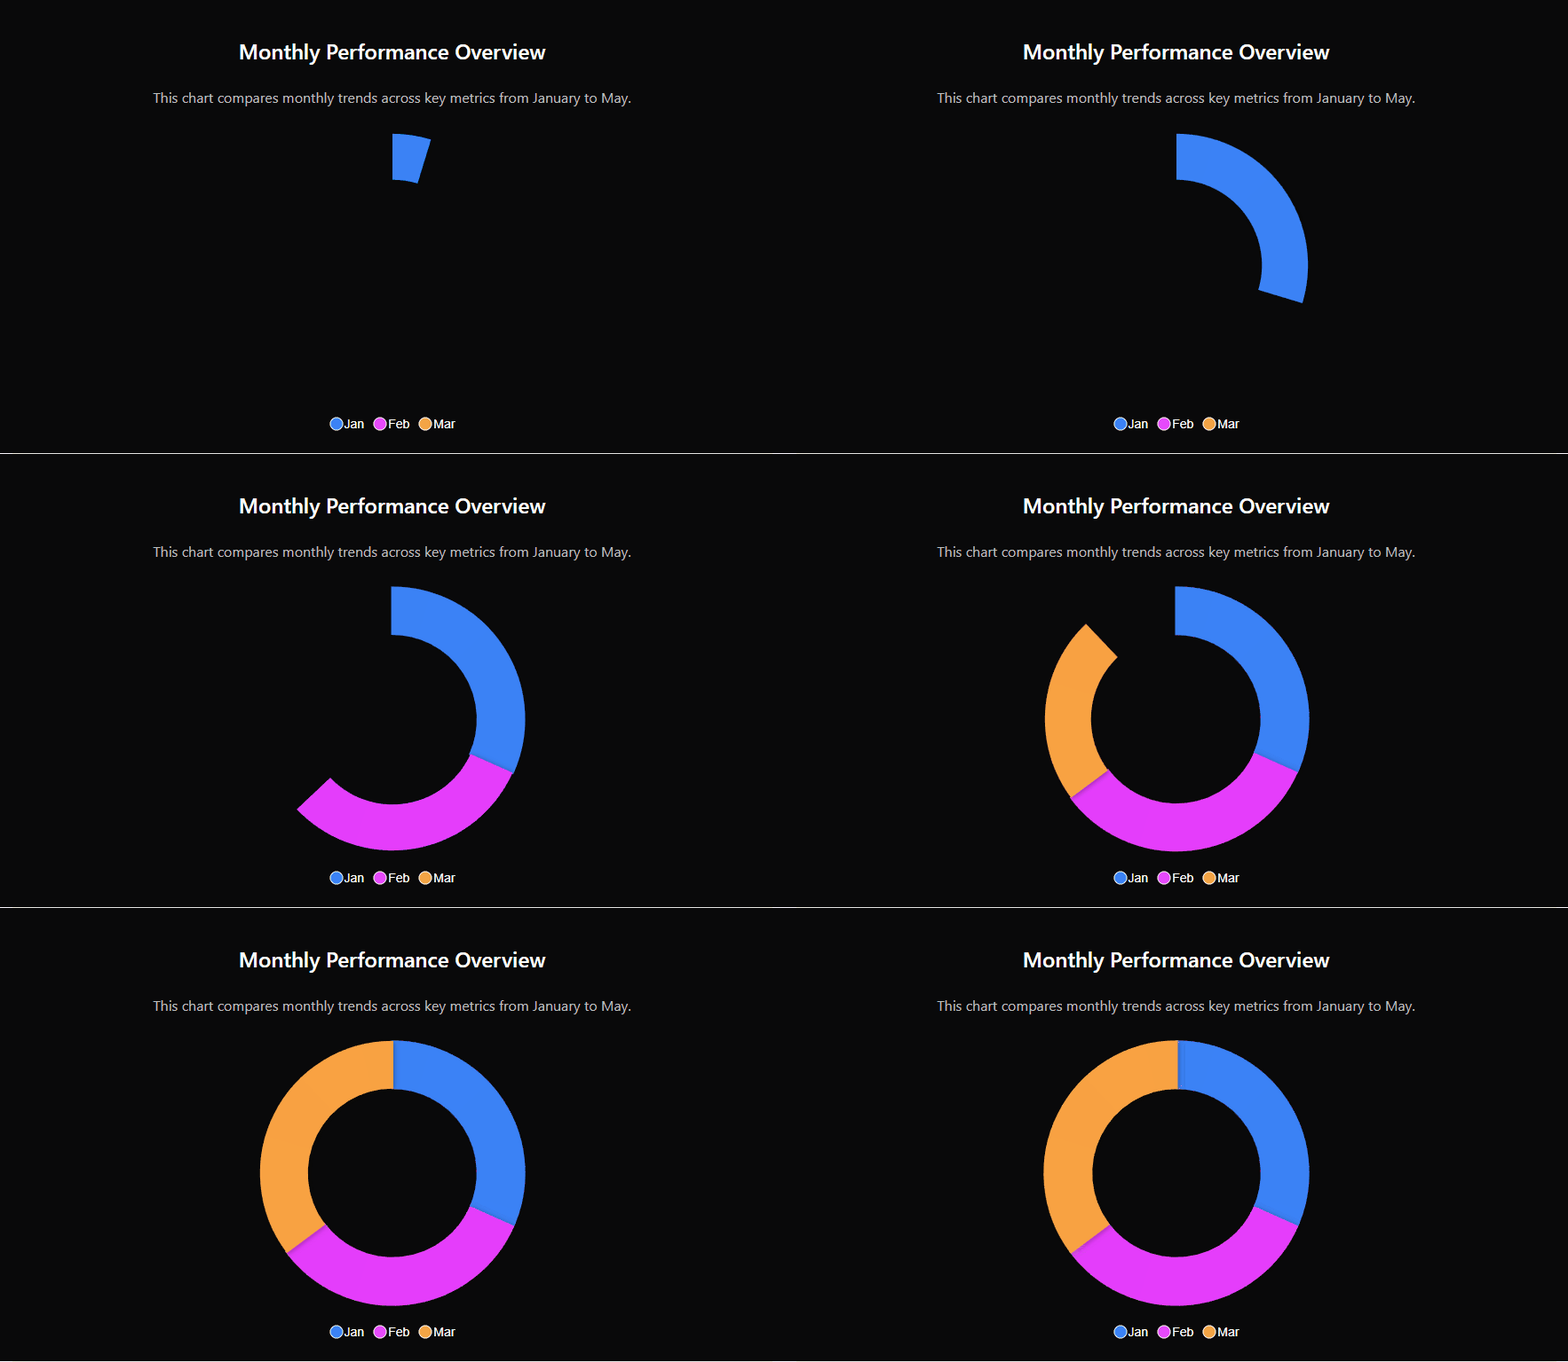
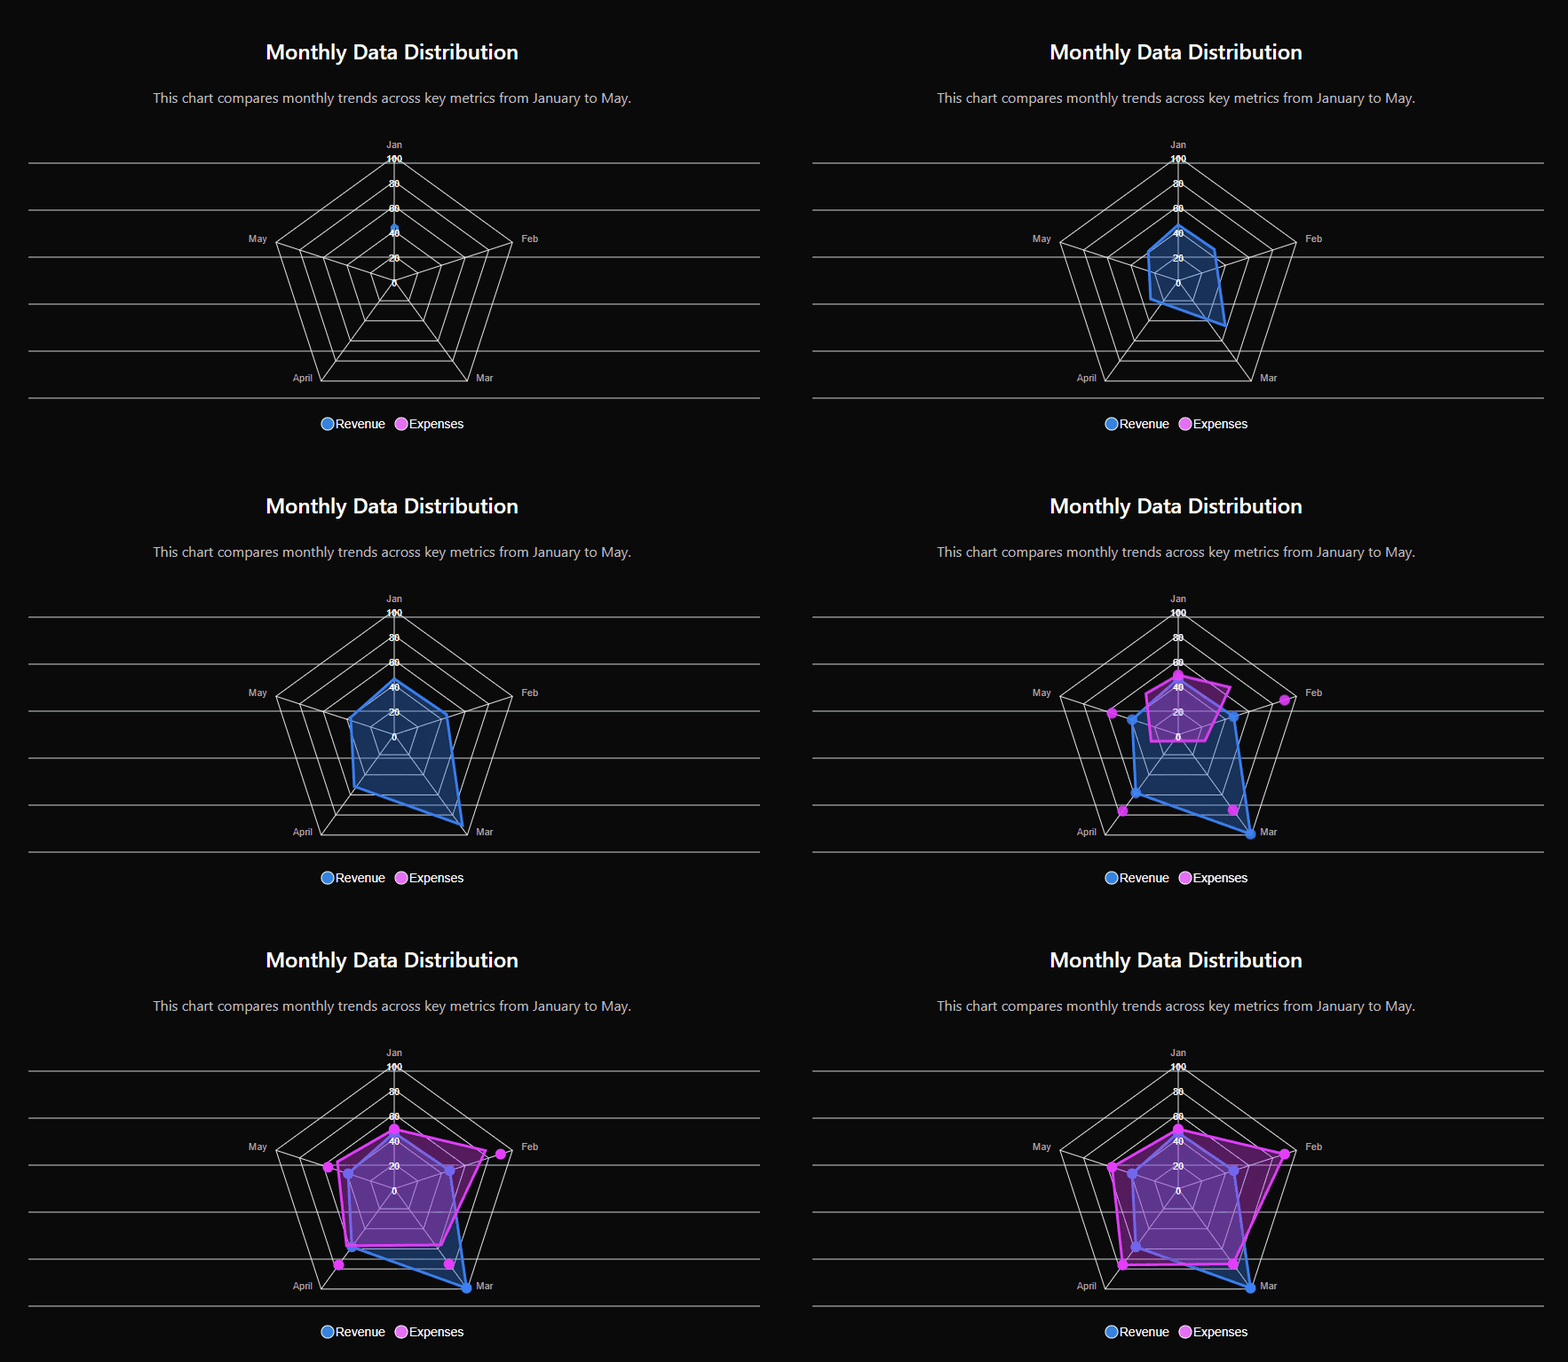
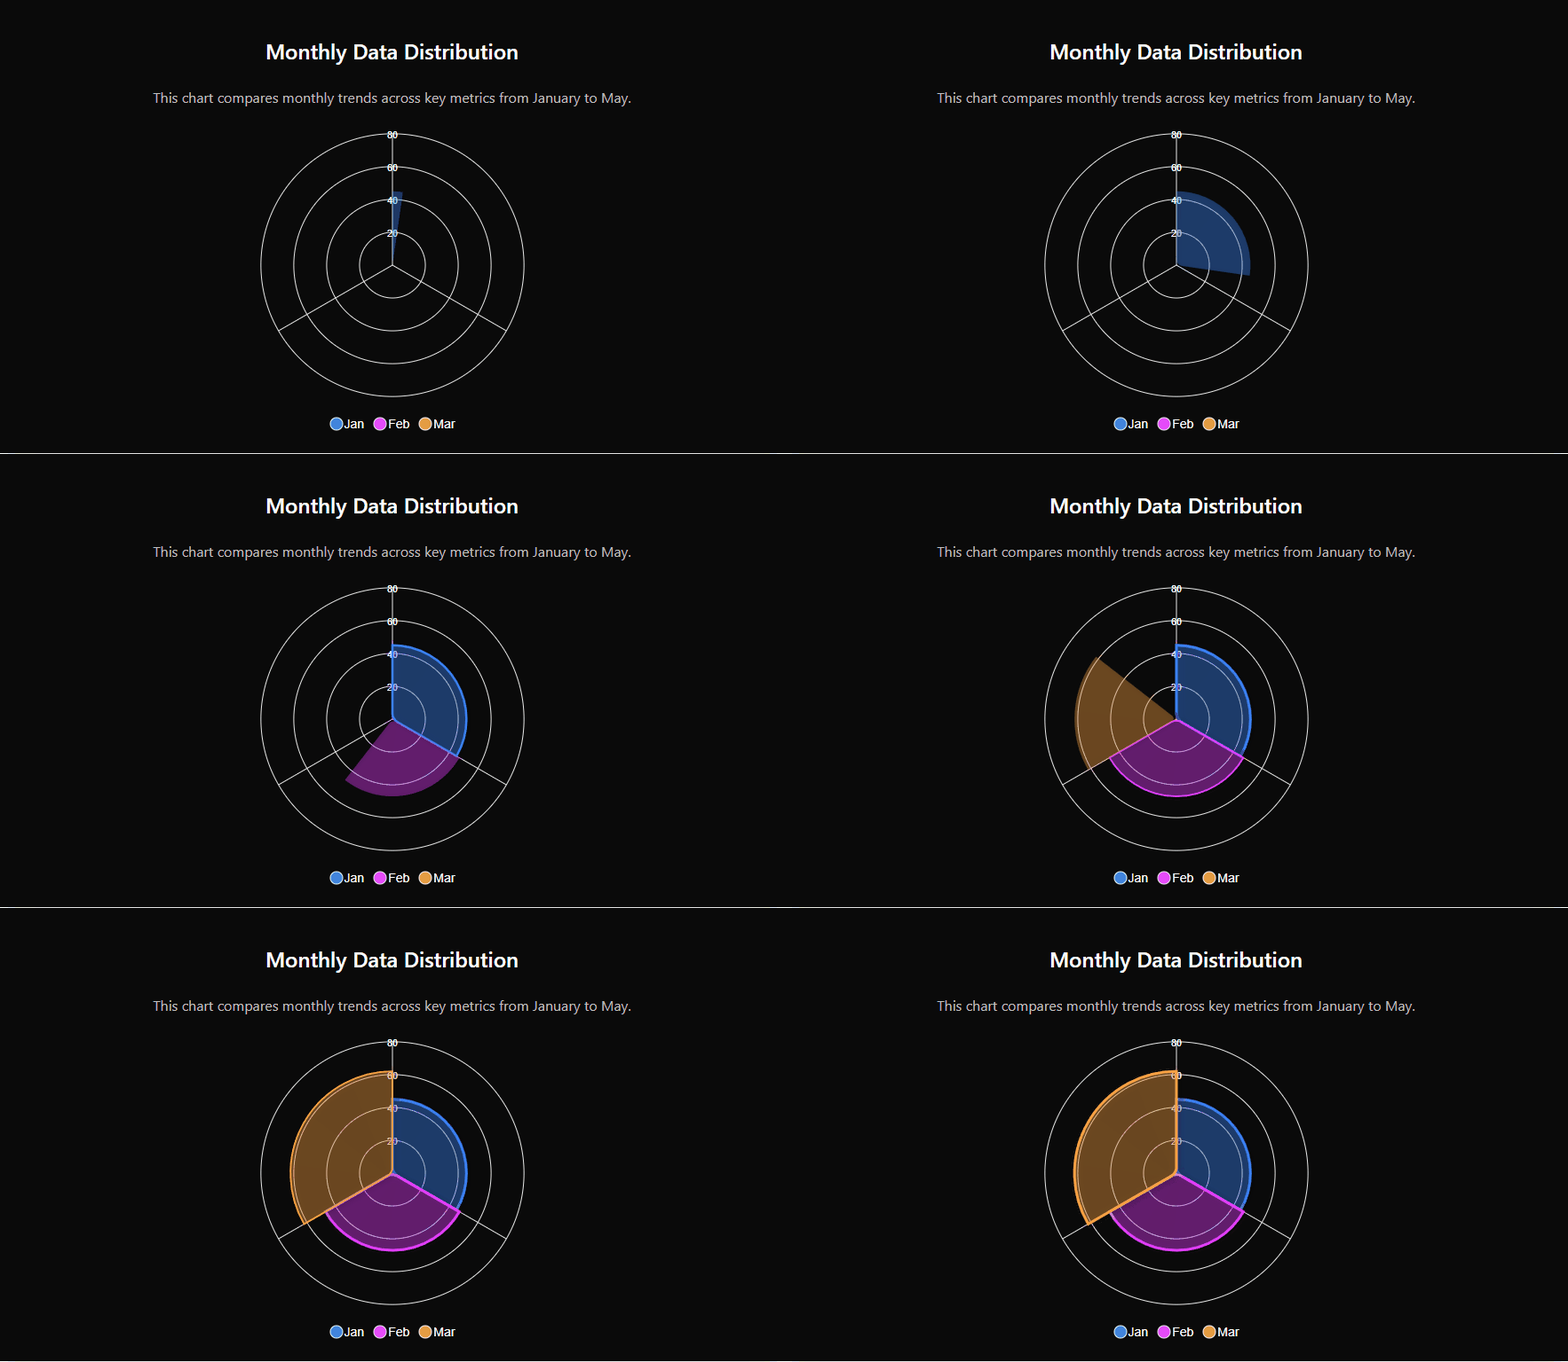
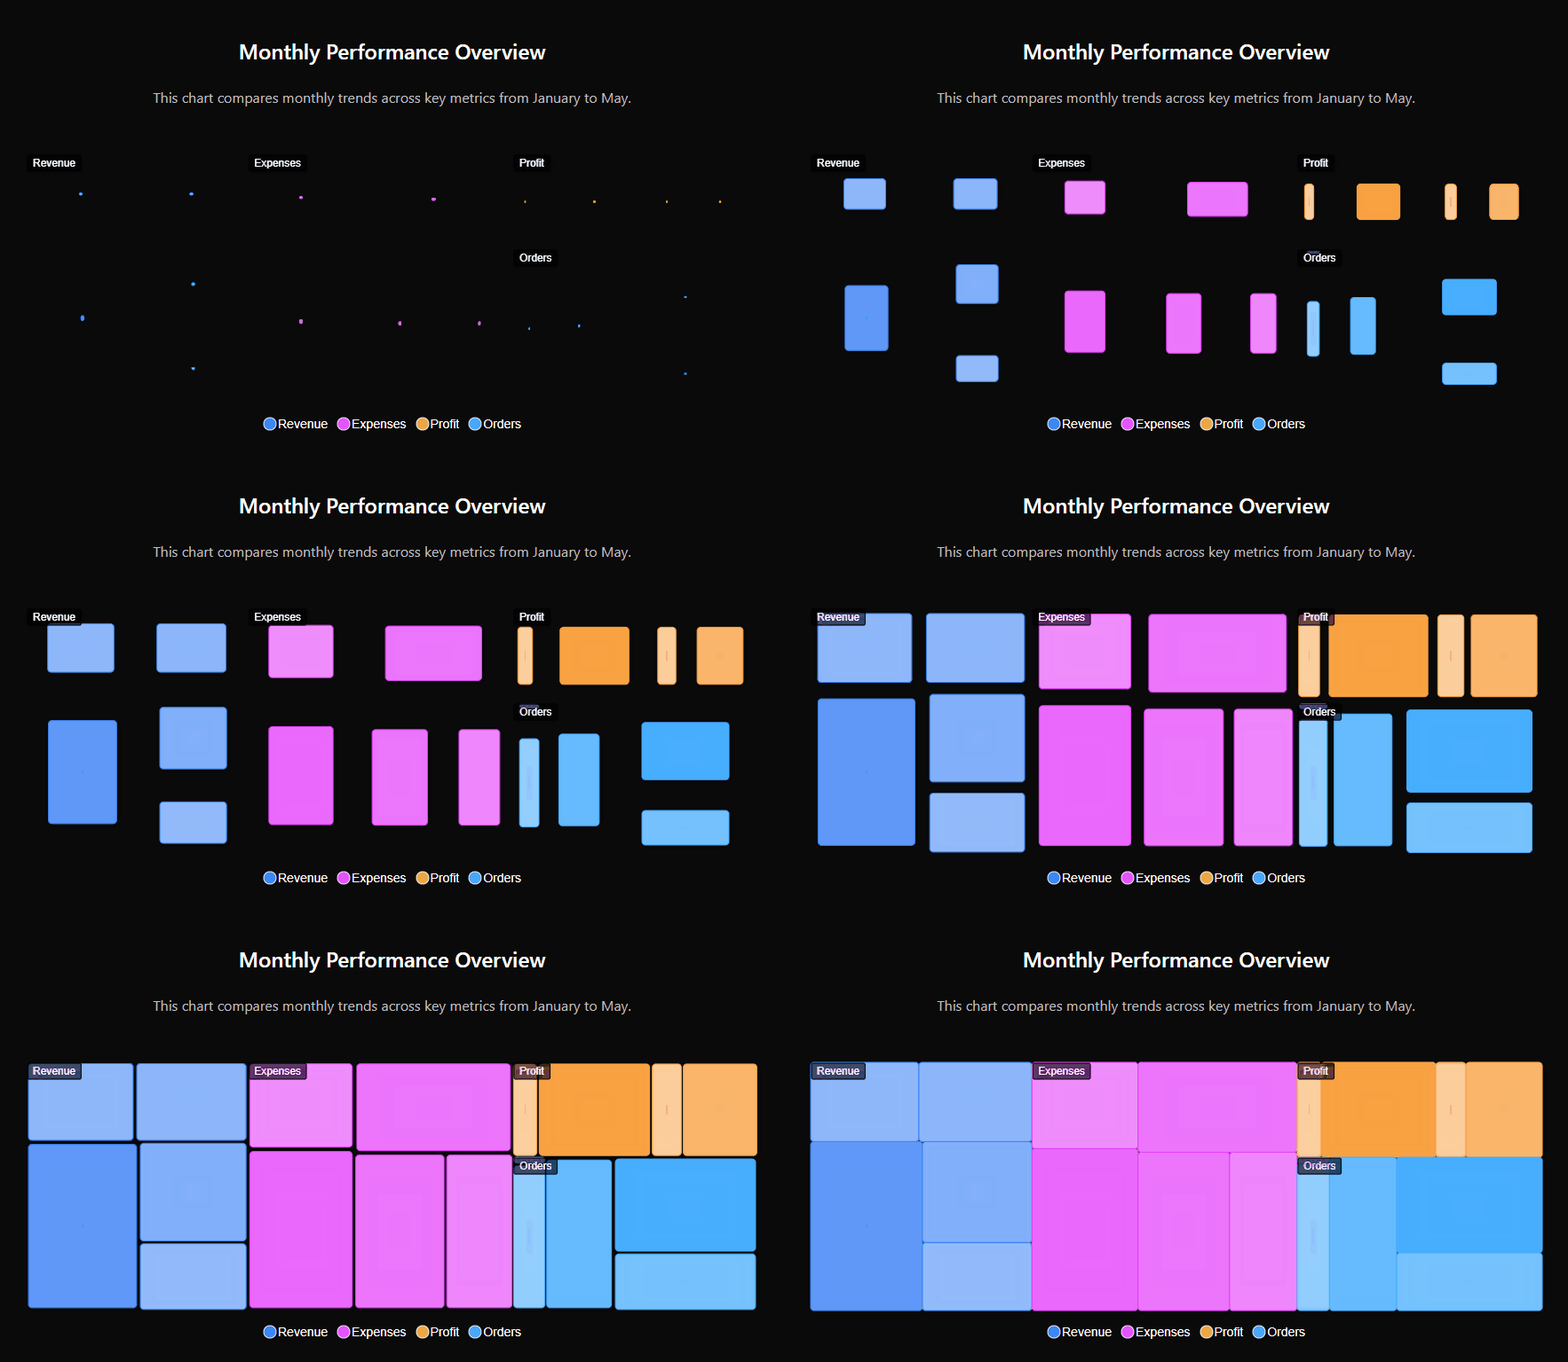
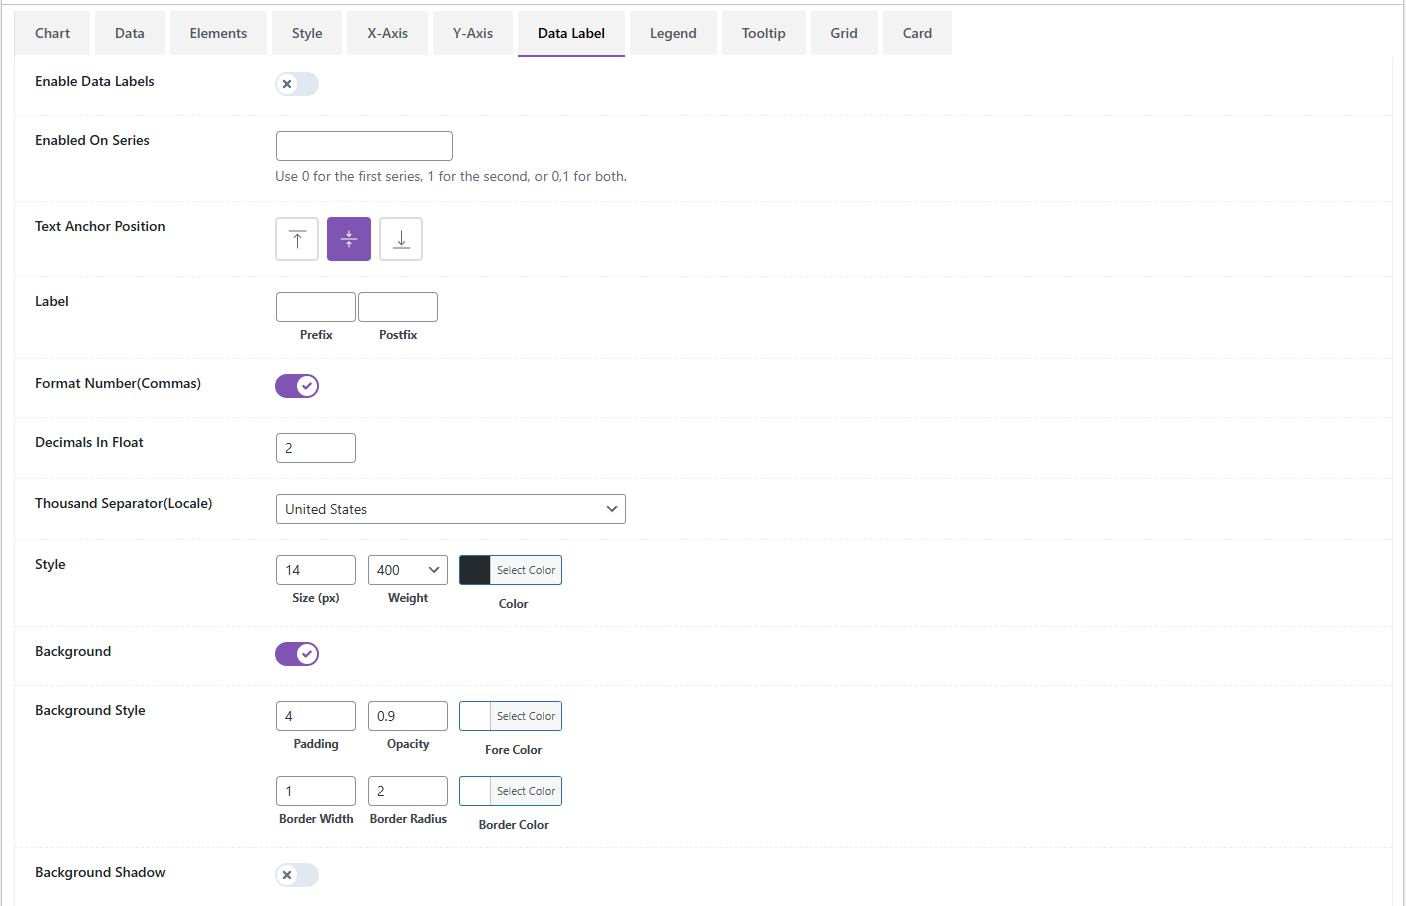
Ìgbéwọlẹ̀
- Upload the plugin to the
/wp-content/plugins/chartsy/directory or install it via Plugins > Add New. - Activate the plugin through the Plugins menu in WordPress.
- Navigate to Chartsy in the WordPress admin menu to create a new chart.
- Choose your desired chart type and configure your data.
- Style your chart using the comprehensive settings tabs: Chart Settings, Legend, Axes, Tooltips, and Card Styling.
- Use the shortcode
[Chartsy id="SLIDER_ID"]to display your chart anywhere on your site, whereSLIDER_IDis the ID of your chart.
FAQ
-
How do I create a chart?
-
Navigate to Chartsy > Add New in your WordPress admin, configure your chart settings and data, and save. Then use the shortcode provided in the sidebar to display it on any page or post.
-
Does this plugin support responsive design?
-
Absolutely! All charts created with Chartsy are fully responsive and adapt to different screen sizes.
-
Can I export my charts?
-
Yes, you can enable the interactive toolbar in the settings, which allows users to download the chart as an image (PNG/SVG) or as data (CSV/PDF).
-
Will this work with my page builder?
-
Yes, Chartsy works with all major page builders like Elementor, Divi, Beaver Builder, and Gutenberg via the shortcode implementation.
-
What kind of support do you provide?
-
We provide 24/7 dedicated technical support for all our users. If you encounter any issues, simply contact us through our website.
Àwọn àgbéyẹ̀wò

Àwọn Olùkópa & Olùgbéejáde
“Chartsy” jẹ́ ètò ìṣàmúlò orísun ṣíṣí sílẹ̀. Àwọn ènìyàn wọ̀nyí ti ṣe ìkópa sí plugin yìí.
Àwọn Olùkópa
Ṣe o nífẹ̀ẹ́ sí ìdàgbàsókè?
Ṣàwárí koodu, ṣàyẹ̀wò ibi ìpamọ́ SVN, tàbí ṣe àgbékalẹ̀ sí àkọsílẹ̀ ìdàgbàsókè nípasẹ̀ RSS.
Àkọsílẹ̀ àwọn àyípadà
1.0.0
- Initial release
- ApexCharts.js-powered responsive interactive charts
- 18+ advanced chart types supported (Line, Area, Bar, Heatmap, Treemap, etc.)
- Real-time admin preview system
- Advanced customization for axes, legends, tooltips, and markers
- Interactive toolbar with zoom, pan, and download options
- Shortcode implementation for universal compatibility
1.0.1
- Pie chart options fixed
- Add label color options
1.0.2
- Improved Radialbar charts
- Improved Timeline chart
- Create elementor widget
1.0.3
- WordPress 7.0 compatibility verified
- Added Free vs Pro comparison table in settings
- Fixed data mapping and rendering for candlestick and timeline charts
- Improved data fields display logic in the editor
- Fixed translation warning in Elementor widget and minor shortcode display issues